- Published on
Cypress vs Playwright – Clash of the Titans: Setup (2)
- Authors

- Name
- Aleksandar Zeljković
- @a_zeljkovic
In this series of articles, I am going to dive deep into the capabilities of two popular e2e testing frameworks: Cypress and Playwright. The comparison will cover technical specifications, documentation, setup, features, CI/CD integration, etc. The goal is to uncover the main differences and pros/cons of each framework and potentially help anyone who wants to make a decision between these e2e testing frameworks.
Installation
Cypress
The easiest way to install Cypress is via npm/yarn:
npm install cypress --save-dev
or
yarn add cypress --dev
Playwright
There are two different types of Playwright installation:
- Playwright library – minimal and browser automation focused.
- Playwright test – Playwright library extended with the testing framework, enables assertions, reporting, parallelization, etc. Focused on e2e test automation. In this series of articles, we are going to focus on the Playwright test. It can be installed in two ways:
- manually – install the Playwright test:
npm install -D @playwright/test
And then install browsers:
npx playwright install
- scaffolding a new project:
npm init playwright@latest
The terminal wizard will guide a user through the configuration process. The following parameters will be set:
- Do you want to use TypeScript or JavaScript?
- Where to put your end-to-end tests?
- Add a GitHub Actions workflow?
Once this is configured, Playwright Test and default browsers will be installed. Also, the sample configuration file (playwright.config.js) will be created in the project root folder and sample test file (example.spec.js) will be created in the desired e2e tests folder.
Configuration
Cypress
Cypress can be opened in headed mode with a helper utility (the Launchpad) by running the following command:
npx cypress open
At first, the user will be prompted about the desired type of tests that he wants to run (e2e or component test), and also informed whether or not this test type is configured. If the user chooses the e2e tests, default configuration files will be created and displayed:
cypress.config.js– all Cypress specific configuration parameterscypress/support/e2e.js– a place to import additional utilities or modify behavior programmaticallycypress/support/commands.js– a place to define/redefine Cypress commands
After these config files are generated, the user can select a browser for test execution. Cypress-supported browsers that are currently installed on the host machine can be selected.
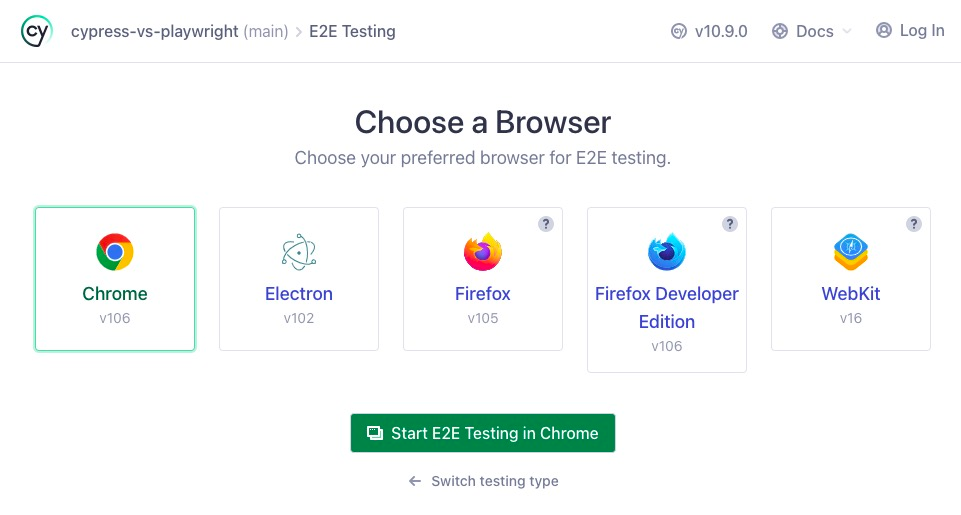
Once this is done and the user clicks the Start E2E Testing button, if no test files are found within the Cypress directory, Cypress will allow you to generate some example specs or to start writing new tests.
Playwright
By default, Playwright configuration parameters are stored in playwright.config.js file, within the config object. The following configurations can be done:
- basic test configuration (base URL, browsers, viewport, timeout, etc.)
- browser groups (“projects”), emulation and network parameters
- screenshot, video and test trace recording
- other browser and testing options
Some options from playwright.config.js can be overridden inside test or describe block, and some options can be set via command line:
- specifying tests to run
- run mode
- retries and timeouts
- etc.
Running your first test
Cypress
In Cypress, tests can be run in two ways:
npx cypress run– headless test execution convenient for test execution and CI/CDnpx cypress open– the cypress app convenient for test development and configuration
Let’s take a look at what the Cypress app looks like in action and what can it provide. In the previous section, I described how the initial configuration works, and how to pick a browser. After this is completed, the Cypress test runner is up and running:
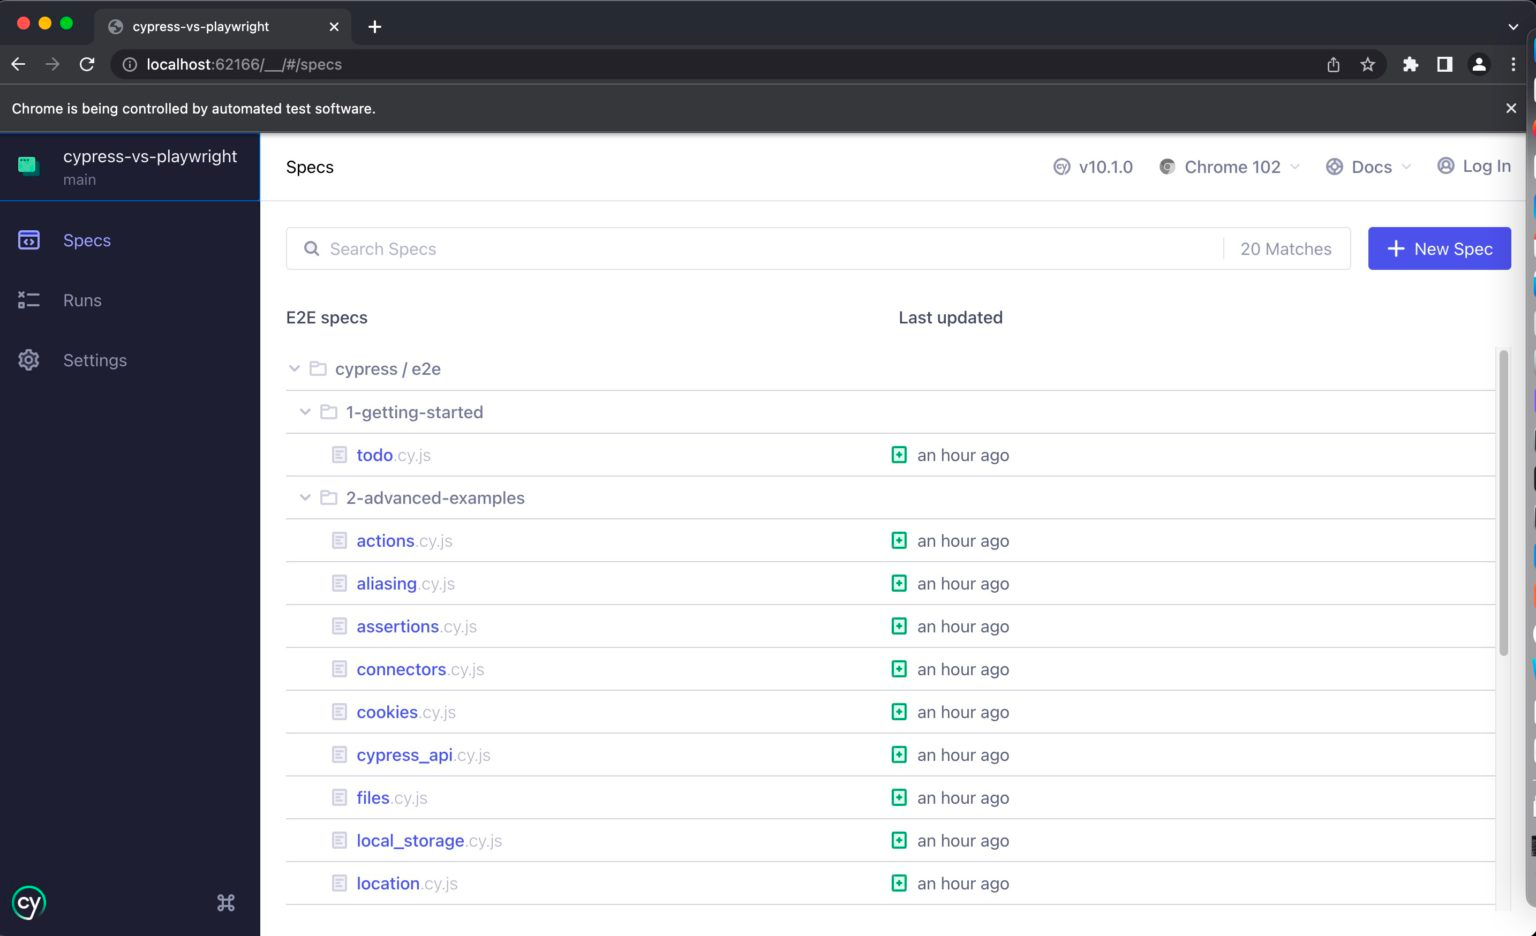
Cypress runner contains three main sections:
- specs – list of all identified spec files within Cypress folder. You can define custom recognition patterns in the
cypress.config.jsfile if you want to omit some specific files or folders - runs – run data sent to Cypress dashboard (requires Cypress dashboard login)
- settings
- project settings – spec patterns, experimental features and resolved configuration (this feature helps you identify which settings are loaded from which source)
- device settings – code editor, proxy settings and testing preferences
- dashboard settings – Cypress Dashboard Project ID
To run a test from a specs list, the user should click on the desired spec file, and all tests within the spec file will be executed:
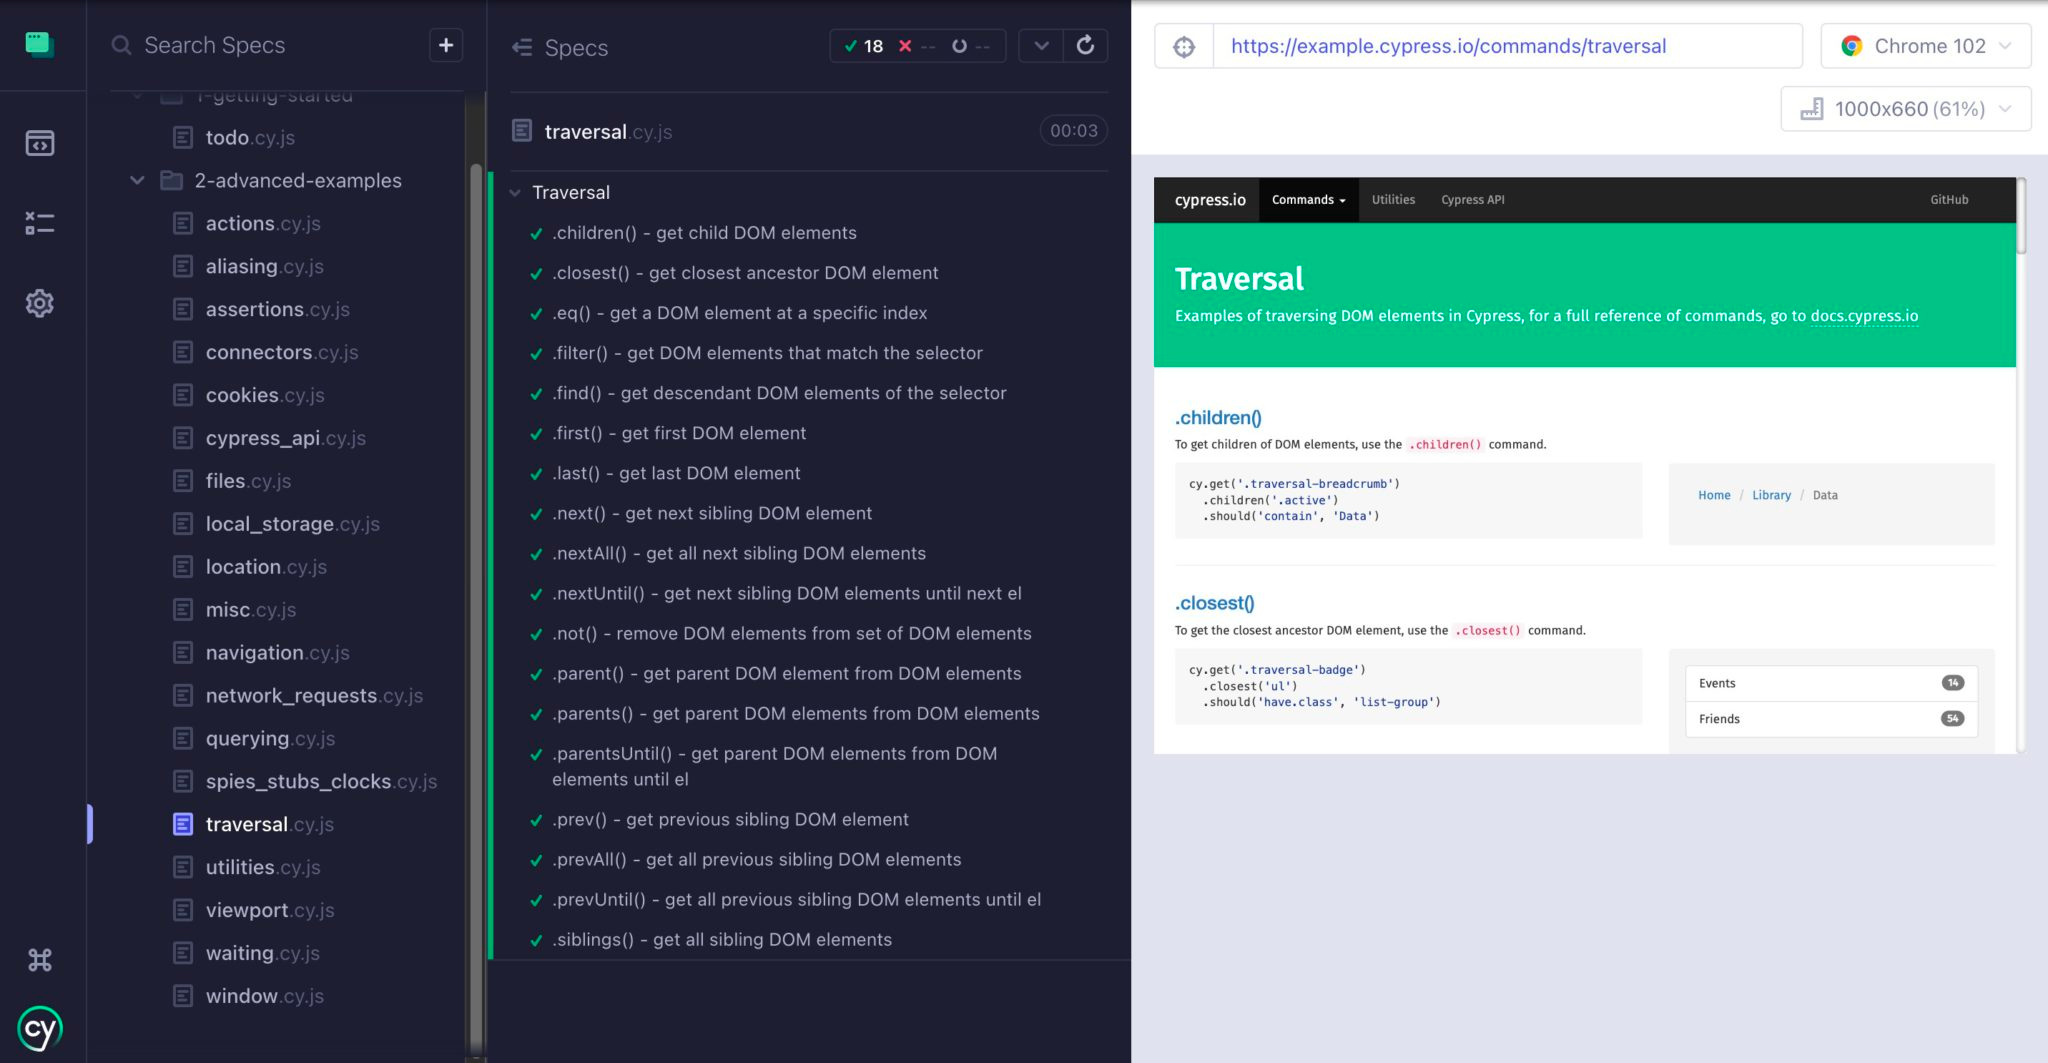
Once the test execution is finished, the report is visible within the application. Every test within a spec file can be expanded by clicking on it. The user can hover over a specific test step and the DOM snapshot in a particular moment will be displayed in the browser. This feature (called “time travel”) drastically improves the debugging experience since the user is able to check how the page looks at any moment of the test. Further, snapshots can be pinned by clicking on them. This will prevent showing any other snaphosts by hovering on them, and enable user to inspect the page at the current snapshot.
Now let’s run tests from the command line by running npx cypress run. Once this is done the report is printed on the CLI:
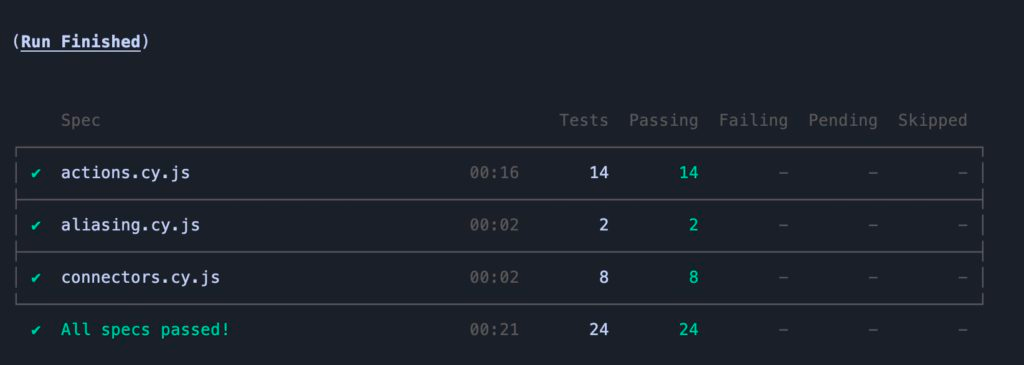
This report contains a summary of the test run, and above, details for every test in particular can be found:
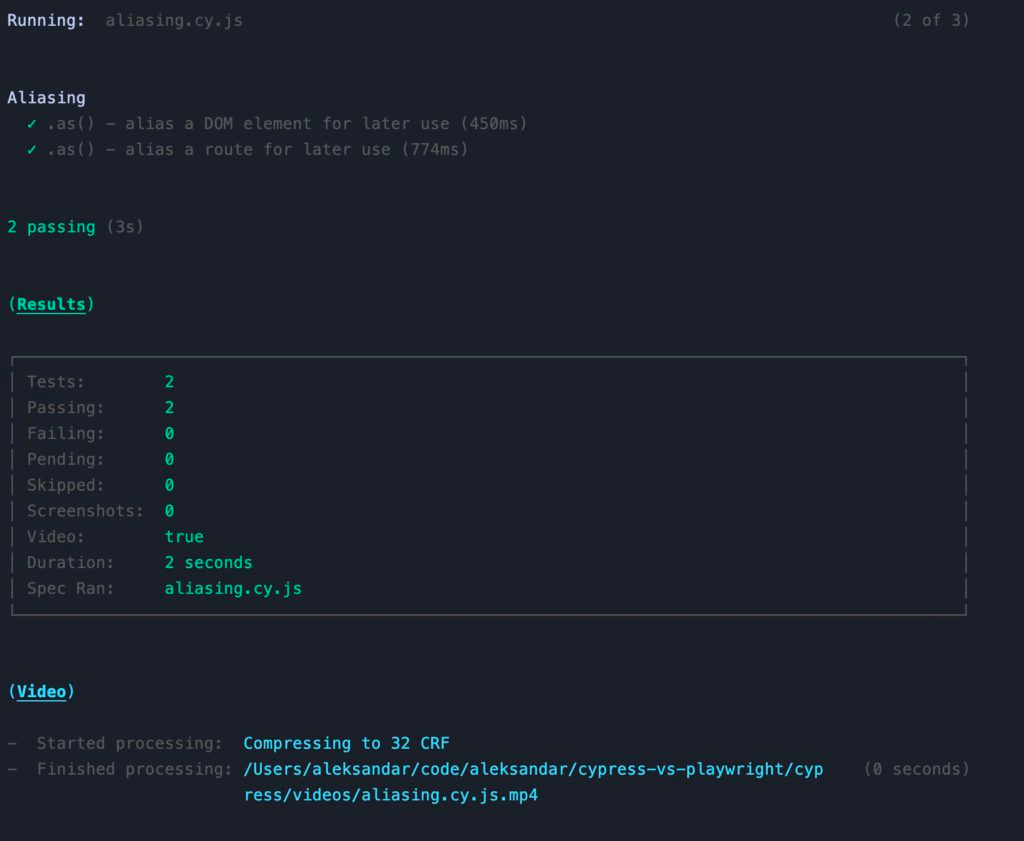
This report contains a breakdown of tests within a spec file, execution results and a path to recorded videos and screenshots.
Playwright
In Playwright, tests can be run in three ways:
npx playwright test– headless test execution convenient for test execution and CI/CDnpx playwright test--headed – headed test execution convenient for debugging and observationPWDEBUG=1 npx playwright test– Playwright test debugger which enables step-by-step test execution for debugging purposes
First, let’s run tests by running npx playwright test. Test execution progress will be shown in the command line, and once tests are finished, a number of passed/failed tests will be displayed. Also, the command that will serve the HTML report will be shown: npx playwright show-report.
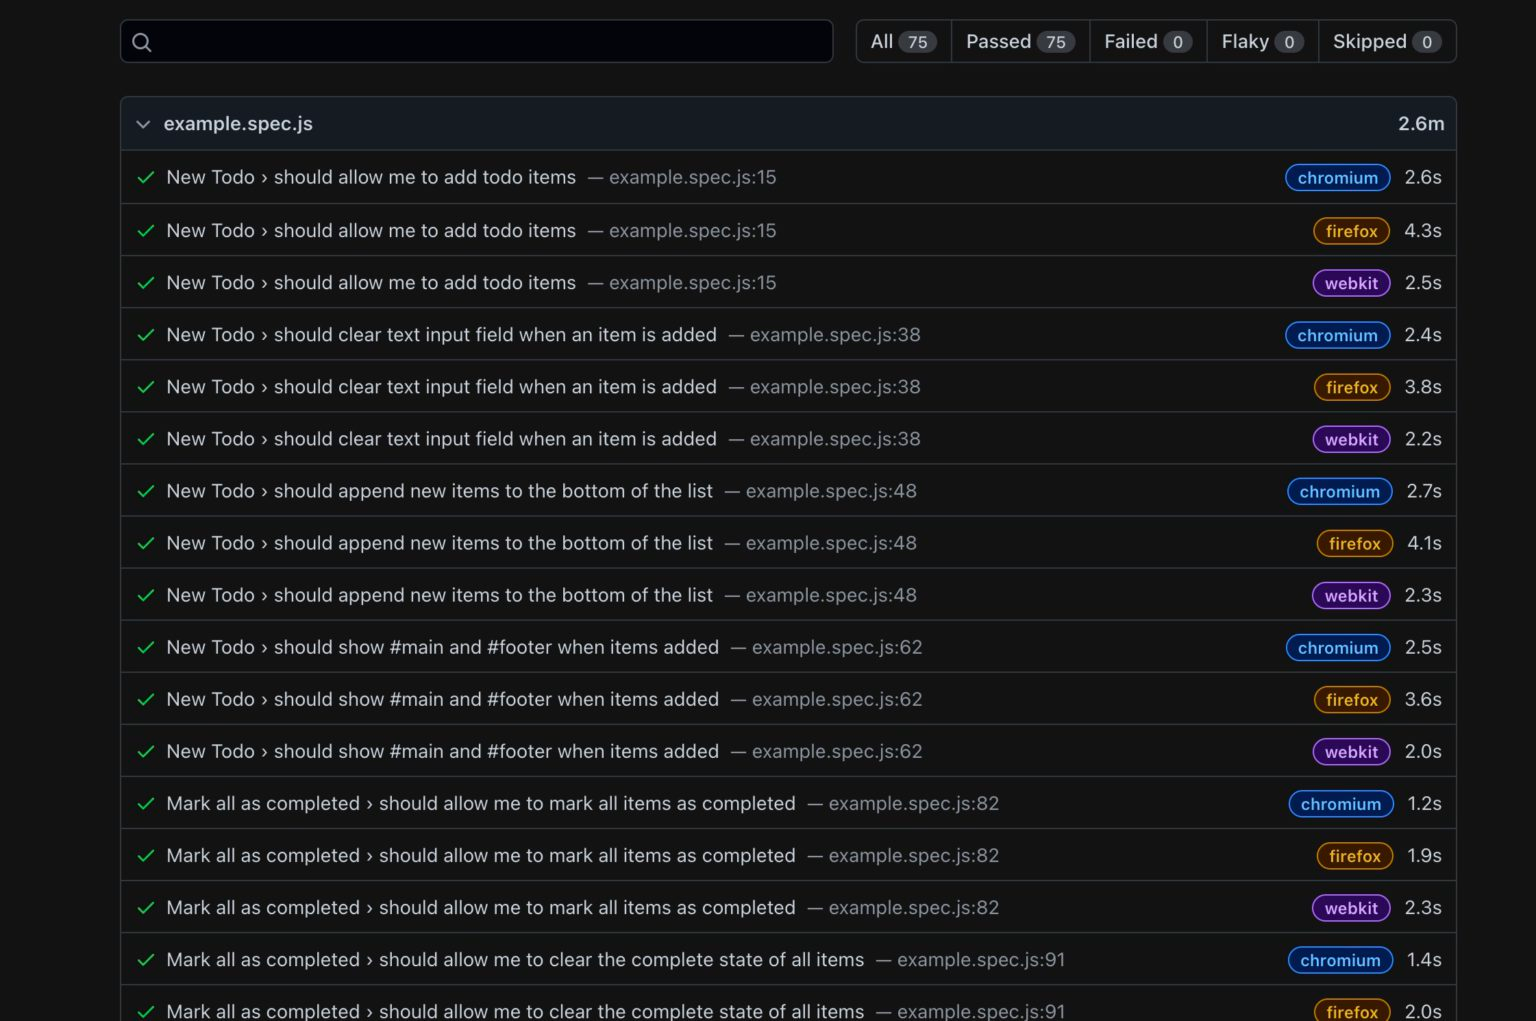
The test report contains all the necessary information about the test execution:
- execution stats (passed/failed/flaky/skipped)
- execution time (total/test)
- list of executed tests – tests are grouped by spec file, and every test has a tag of a browser that was used
If the user wants to check the details of a particular test, he can click on it and expand it:
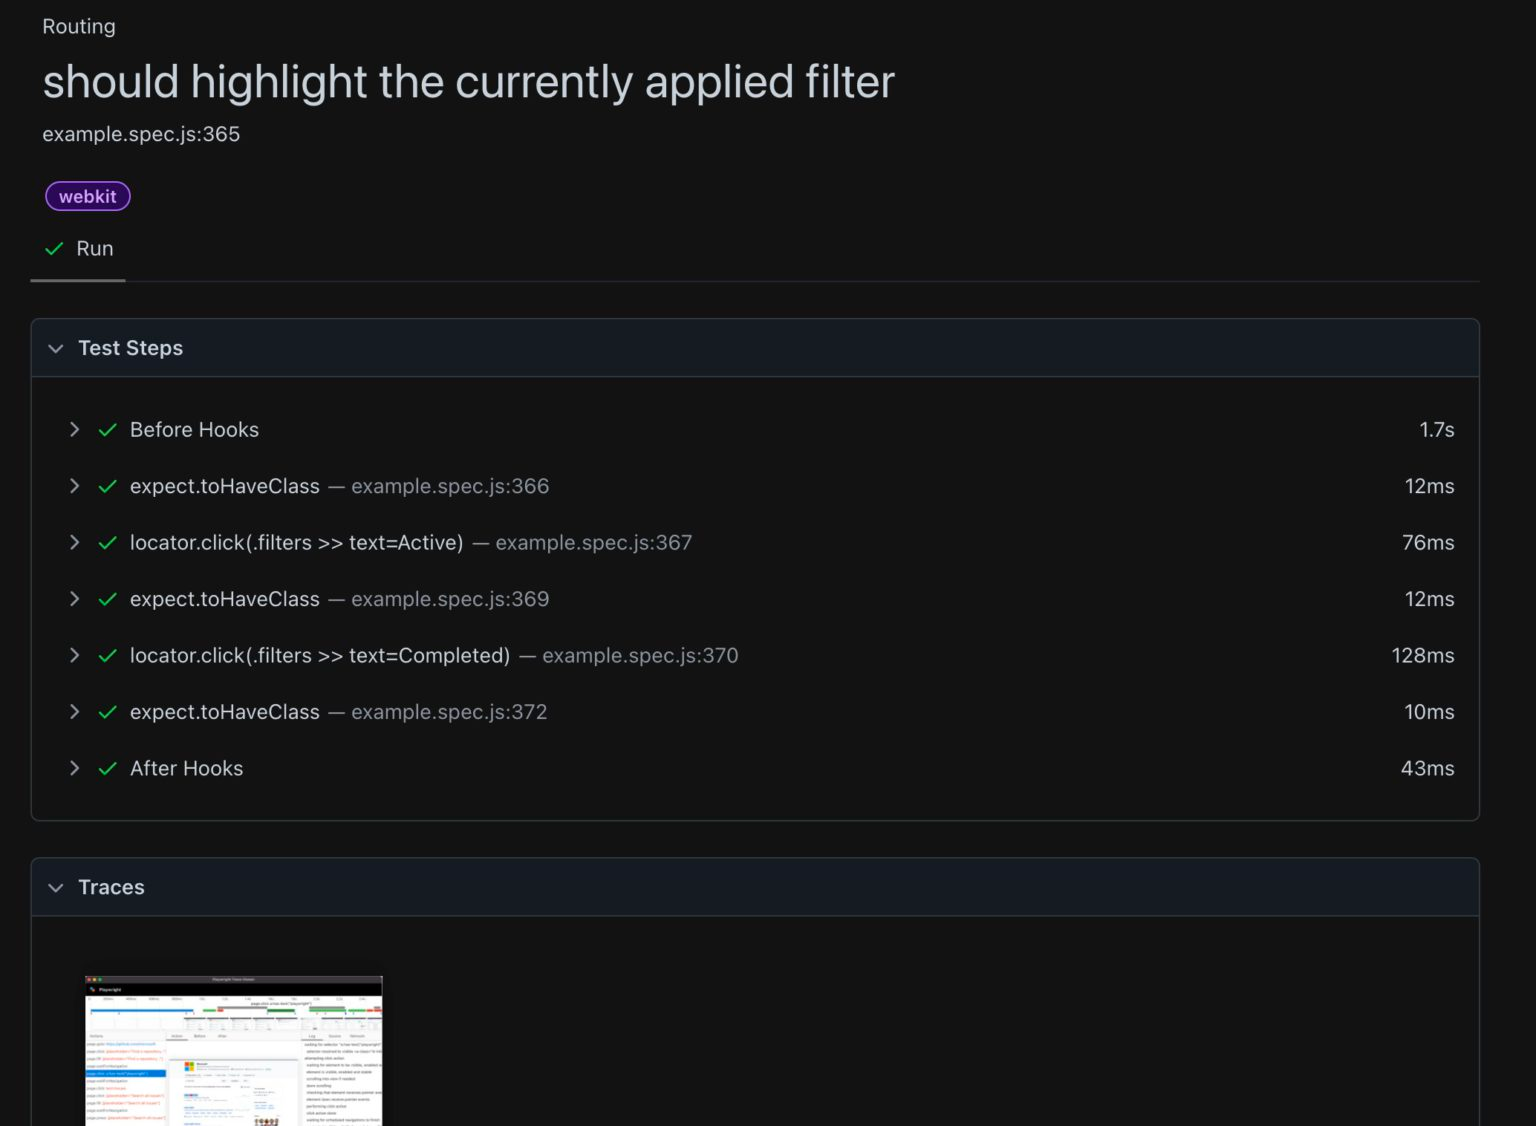
This view is a great starting point for test debugging. The user can see all test steps with the duration of every test. If he expands the test step, a code snippet of the particular step is displayed. Also, the traces file (the concept of traces is going to be explained) is linked to a report and it can be opened directly by clicking on it.
Next, let’s run Playwright debugging tool called Playwright inspector via PWDEBUG=1 npx playwright test.
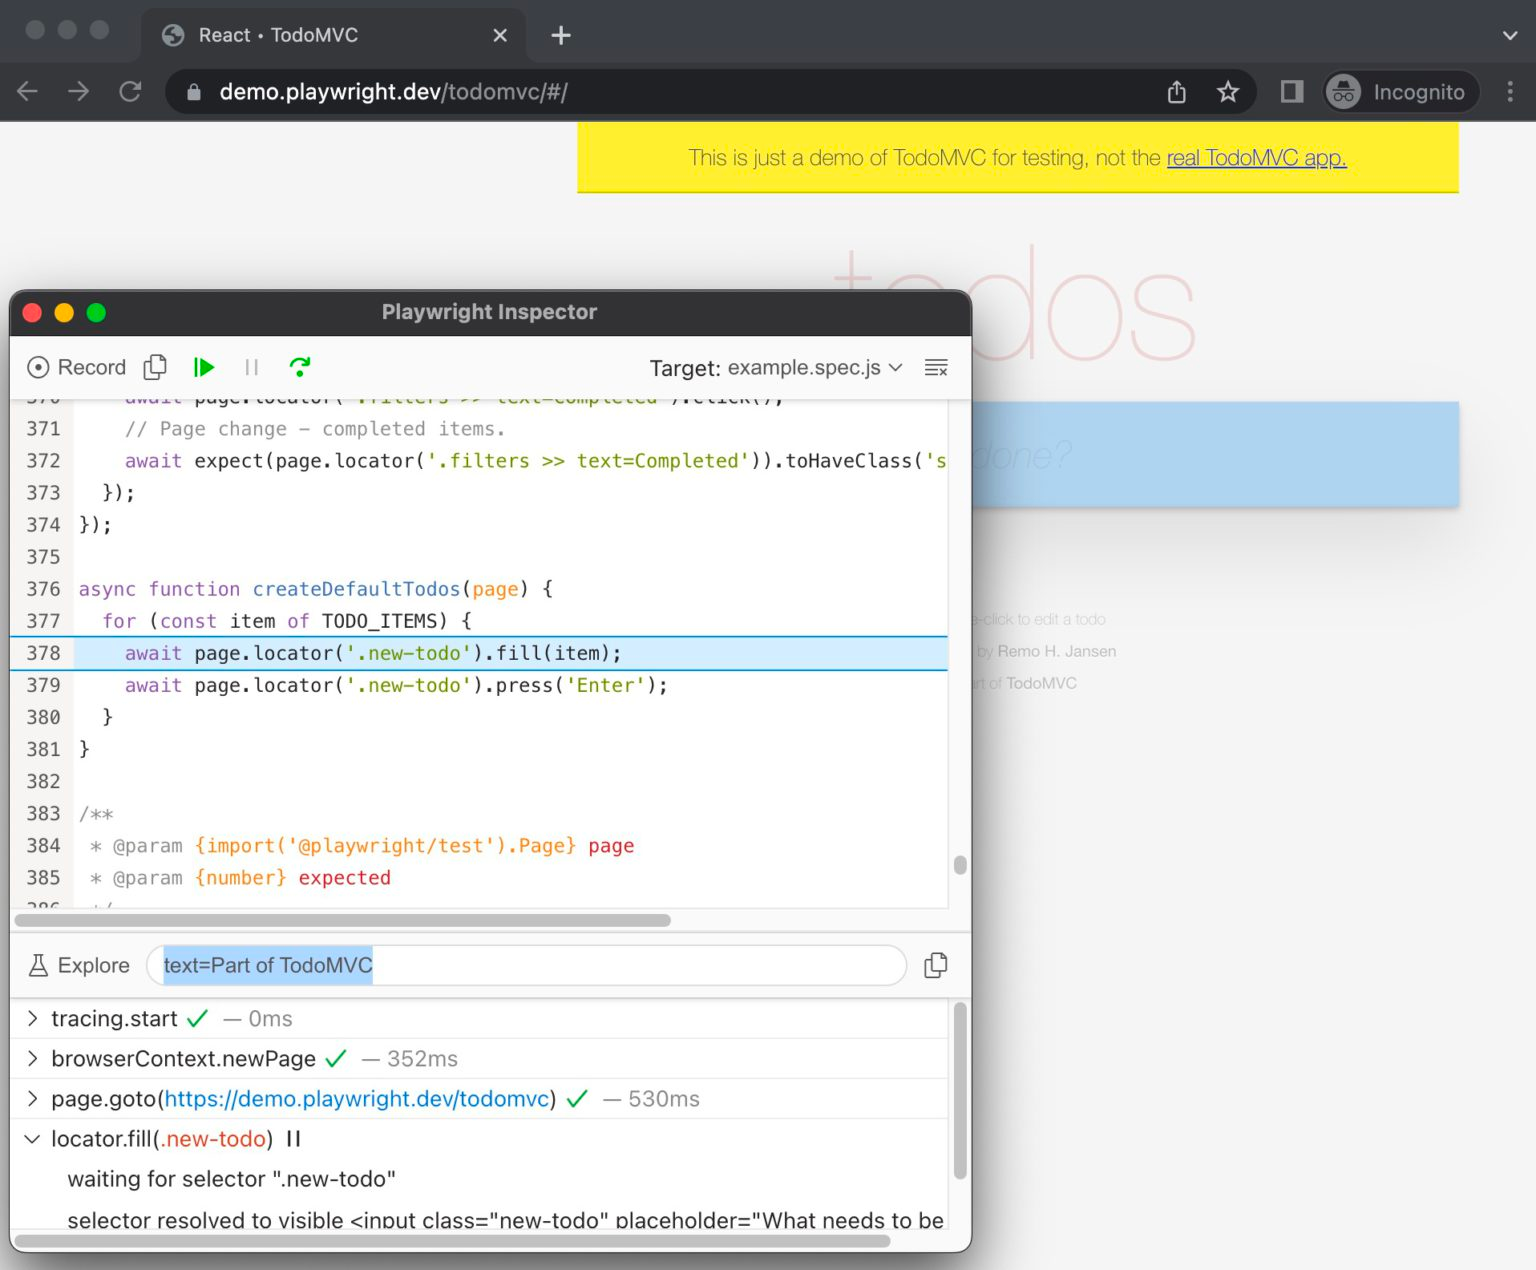
This command will spawn a browser window where the test will be executed, and an inspector debugging helper. The Playwright inspector provides the following functionalities:
- step-by-step test execution
- recorder
- selector explorer